Statistical considerations in randomized controlled trials
Basic statistical concepts
In the setting of a clinical study, sample data are used to make an inference for the entire population. Generally speaking, results from a randomized clinical trial (RCT) will be unlikely to be exactly the same as population parameters, which is the reason for bias involved. In addition, when a RCT were repeated 100 times, results obtained each time would not be identical, which is the reason for uncertainty involved. Statistics provides methods to deal with these uncertainties.
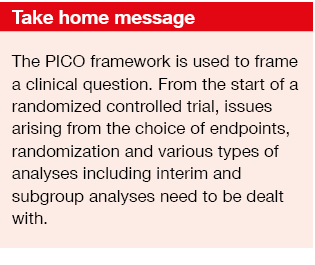
Prior to the start of a study, a research question needs to be established, followed by PICO (population, intervention, comparator, outcome) framework. Once these parameters are clearly defined, investigator can move on to issue of hypothesis testing.
Hypothesis testing
A study hypothesis is a statement concerning the value of one or more parameters of interest within the study population. It is difficult to prove that a study hypothesis is true using sample data, because the hypothesis is concerning the parameters at the population level and usually not all the data from the population will be included as sample data in a trial. Therefore, a “falsificationist” approach is used: the original study hypothesis is turned into the opposite which has been termed as null hypothesis (H0), and a researcher tries to reject the null hypothesis. The original study hypothesis has been termed as alternative hypothesis (H1). In a study with a research question asking whether there are differences in a certain clinical outcome between new treatment and standard of care, the null hypothesis can be that there is no difference between two treatments with regard to the certain outcome. If the study provides enough evidence to reject the null hypothesis, a significant difference between two treatments is then demonstrated through the study. If not, there is no significant difference, which means that there is not enough evidence to conclude that there is a difference between two treatments. The insignificant results can be due to many reasons, and insufficient sample size is one of the reasons.
One-sided hypothesis testing shows if one treatment is superior to the other. This gives rise to a hazard ratio (HR) below or above 1. In the examples below, progression-free survival (PFS) is the assessed outcome.
+ H0: PFS1 < PFS0, HR > 1.
+ H1: PFS1 > PFS0, HR < 1.
Two-sided testing establishes the difference between two treatments. In the example below, the null hypothesis says PFS does not differ across the treatments, whereas the alternative hypothesis says it does.
+ H0: PFS1 = PFS0, HR = 1
+ H1: PFS1 ≠ PFS0, HR ≠ 1
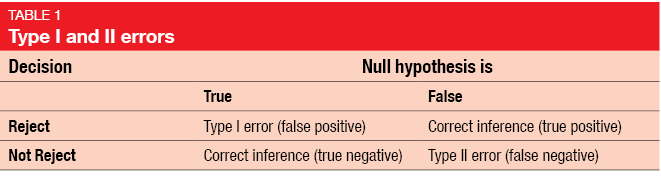
Type I and II errors, power and p value
In a clinical study, researchers need to make a decision whether the null hypothesis can be rejected or not. The decision based on study results is one thing and the fact whether a null hypothesis is true is another. Here, the type I and type II errors come into play (Table 1). Type I error means that a false positive decision is made: the null hypothesis is rejected when it is actually true [1]. On the other hand, type II error relates to false negative decision: the null hypothesis is false, but the researcher fails to reject it. While conventionally type I error is defined at a level of 5 %, type II error has been set at 10 % or 20 %. The power of a study describes the probability of detecting effectiveness when the intervention is truly effective, leading to a true positive conclusion. By definition, the power amounts to 80 % or 90 %, as it is calculated as 1 minus type II error. Of course, the power of a study is the better the higher it is.
The p value describes the probability of observing the study result or a more extreme result if the treatment is ineffective. For example, if a targeted drug improves PFS compared to chemotherapy with a p value of < 0.0001, the probability of observing the study result or a more extreme result is 0.0001 if the targeted drug does not improve PFS. It is still possible to obtain an extremely small p value when the new intervention shows no activity and when this occurs the type I error is made. Notably, the p value does not reflect the probability of the treatment being ineffective.
Confidence intervals
The confidence interval (CI) is a statistical mean to address uncertainty of results from repeated sampling under the same conditions. A 95 % CI signifies that in 95 times out of 100, the CI will contain the true value of the population parameter that was tested. If the CI for the HR crosses 1, this indicates insignificant result.
Sample size calculation
The sample size is usually calculated based on the primary outcome, which implies that a clearly defined primary objective and primary endpoint must be established. Moreover, the minimal clinically important difference/ proportion or width of the confidence interval are necessary for the calculation, as well as the choice between one-sided and two-sided hypothesis testing. Finally, the significant level and target power need to be considered.
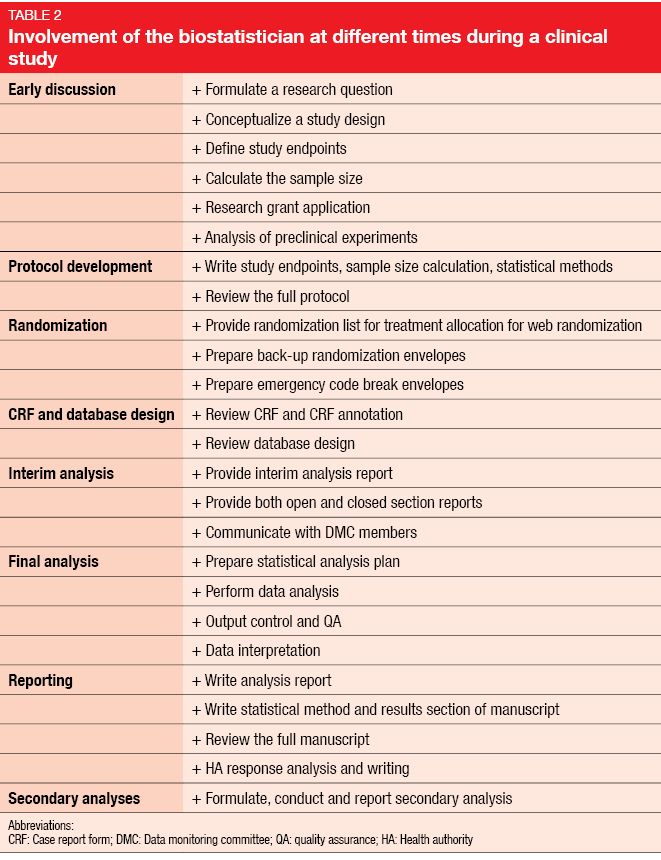
Statistical issues of RCTs
From the onset of study conceptualization, statistical issues need to be dealt with. This involves protocol development and randomization as well as the interim and final analyses and reporting. Table 2 illustrates the biostatistician’s contribution along the way.
Endpoints
It is recommended to use only a single primary endpoint. Multiple primary outcomes are of course an option, but in this case, methods of multiplicity should be considered. The EMA guideline on multiplicity issues in clinical trials contains recommendations of different methods to adjust for multiplicity. When two or more primary variables are needed to describe clinically relevant treatment benefits [2], all of these must be significant to enable the researcher to claim clinical benefit. If two or more primary variables are ranked according to clinical relevance, the most clinically relevant outcome must be tested first. Only if this is significant, the second one would undergo evaluation.
When multiple secondary outcomes have been defined, there are three different settings. If all of the variables are intended to provide only supportive evidence, no confirmatory claim can be made. The second scenario relates to secondary variables which may become the basis for additional claims; here, a hierarchical approach can be considered. The primary outcome needs to be significant prior to testing the secondary outcomes. Finally, if the variables are indicative of a clinical benefit but were not planned as primary outcomes, further studies are called for.
Randomization
Block-stratified randomization has become increasingly popular. Patients are allocated to treatment within a subgroup of a certain size; this implies that allocation is balanced within each block and offers an obvious advantage if the study has to be terminated prematurely. In a setting of simple randomization without blocks, the first 50 patients might be randomized to placebo and the next 50 patients to the intervention, which creates a problem of severe imbalance when the study is prematurely stopped, such as at 25 patients. The stratified randomization approach guarantees allocation balance within each stratification factor. The use of a block size of only 2 patients should be avoided due to high risk of guessing the treatment allocations
Allocation concealment means that the person taking care of the randomization is unaware of what the next treatment allocation will be. This prevents manipulation of the allocation.
Analyses
Interim analyses need to be pre-planned. Aspects to consider in this context include the number of patients and the time of the analysis. Both safety data and efficacy data can be analyzed. An important topic is early stopping criteria, which must be defined in advance.
The final analysis requires a statistical analysis plan detailing the type of analysis, the study population (intent-to-treat, per-protocol, treated), the statistical method, and mock Tables/ Figures/ listings that give an idea of the appearance of the final Tables and Figures. Ideally, most of the analyses are pre-planned before database lock or breaking the blind. The same methods should be used for the primary efficacy analysis as the methods used for sample size calculation. Exploratory analyses are possible, but researchers should state clearly in their final report that these were not pre-planned.
Subgroup analyses have become a prominent part of many cancer studies. However, their reliability is questionable, as RCTs are usually not powered to support subgroup analysis. Sun et al. published criteria for the assessment of the credibility of subgroup analyses including factors such as design and context [3]. Essential aspects relate to the question of whether the direction of the subgroup effect was specified a priori, and its consistency with other results. A significant subgroup effect should be independent. For example, the analysis might show that males benefit to a greater extent from a certain treatment than females, but this observation loses its value when it is found that patients in the male group are generally younger than those in the female group. Lagakos et al. demonstrated a positive correlation between the number of subgroup analyses run in a trial and the likelihood of false positive results [4].
Reporting
Certain standards have been defined for the reporting of RCTs. The Consort Statement provides a list of items that need to be included [5].
REFERENCES
- https://en.wikipedia.org/wiki/Type_I_and_type_II_errors
- http://www.ema.europa.eu/docs/en/_GB/document_library/Scientific_guideline/2009/09/WC500003640.pdf
- Sun X et al., Is a subgroup effect believable? Updating criteria to evaluate the credibility of subgroup analyses. BMJ 2010; 340: c117
- Lagakos SW, The challenge of subgroup analyses – reporting without distorting. N Engl J Med 2006; 354(16): 1667-1669
- http://www.consort-statement.org/Media/Default/Downloads/CONSORT%202010%20Statement/CONSORT%202010%20Statement%20-%20The%20Lancet.pdf.
Content based on an young oncology preceptorship conducted by JSMO on 8th–10th December 2017 in Singapore, with an unrestricted grant from Boehringer Ingelheim
More posts
New therapeutic options being currently investigated in advanced or metastatic colorectal cancer
Colorectal cancer (CRC) is the second leading cause of cancer death in the United States, and it is the fourth most frequent cancer diagnosis.A current treatment option for RAS and BRAF wild-type (WT) metastatic colorectal cancer (mCRC) is the chemotherapy doublet (FOLFOX/FOLFIRI) with an anti-EGFR monoclonal antibody (cetuximab or panitumumab).
An update and future directions in advanced gastric or gastrointestinal junction cancer (G/GEJC)
With more than 1 million newly diagnosed cases in 2020, gastric cancer (GC) is the fifth most frequent cancer; it was also the third leading cause of cancer-related death worldwide. Gastroesophageal junction (GEJ) cancer concerns a form of gastric cancer developing around the digestive tract where esophagus and stomach connect; in the last years, the prevalence of GEJ constantly increased.
Innovative combinations in esophageal squamous cell carcinoma
Each year, esophageal cancer (EC) is responsible for more than half a million deaths worldwide. Among them, esophageal squamous cell carcinoma (ESCC) accounts for the vast majority (~ 85 %) of EC incidences . At diagnosis, 70 % of ESCC is unresectable [3] and the 5-year survival rate is limited (30 % - 40 %). Patients with advanced or metastatic ESCC have a poor prognosis; their overall survival (OS) after standard first-line chemotherapy is limited to less than a year and other treatment options are scarce.
Novel agents or combinations in recurrent or metastatic nasopharyngeal cancer
Nasopharyngeal cancer (NPC) is a rare malignancy with an incidence of approximately 133,000 annually worldwide, resulting in about 80,000 deaths per year. Whereas early-stage and locally advanced NPC have a good prognosis, treatment of recurrent or metastatic nasopharyngeal cancer is a challenging; it is thus associated with a poor prognosis, especially in patients who have failed two or more lines of systemic therapy, with a median progression-free survival (mPFS) of seven months and median overall survival (mOS) of 22 months.
Preface ASCO Solid Tumor 2022
After 2 years of the COVID-19 pandemic, the Annual Meeting of the American Society of Clinical Oncology (ASCO), was held in Chicago, USA, and virtually from 3rd–7th June 2022.As always, the very much-anticipated event brought leading experts from across the globe together to learn and discuss the groundbreaking updates and scientific advancements which were covered in more than 2,000 abstracts, along with 85 livestream sessions, and more than 2,500 poster presentations.